
2020-May-25
May 24 Water Levels Report
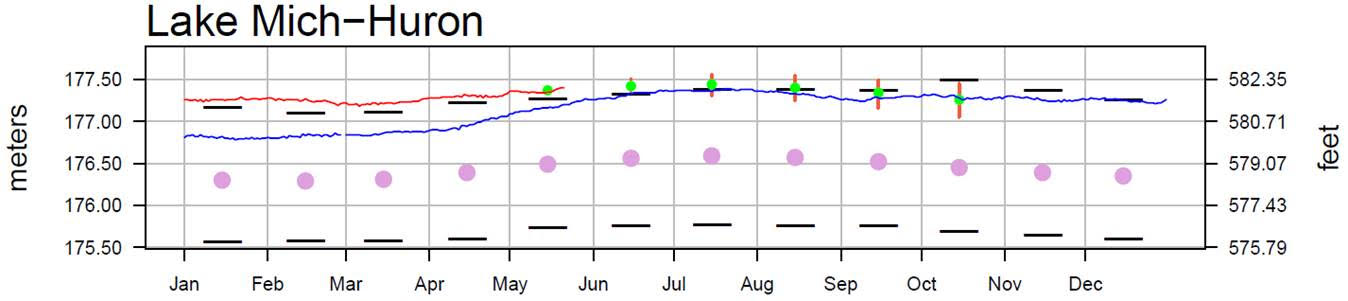
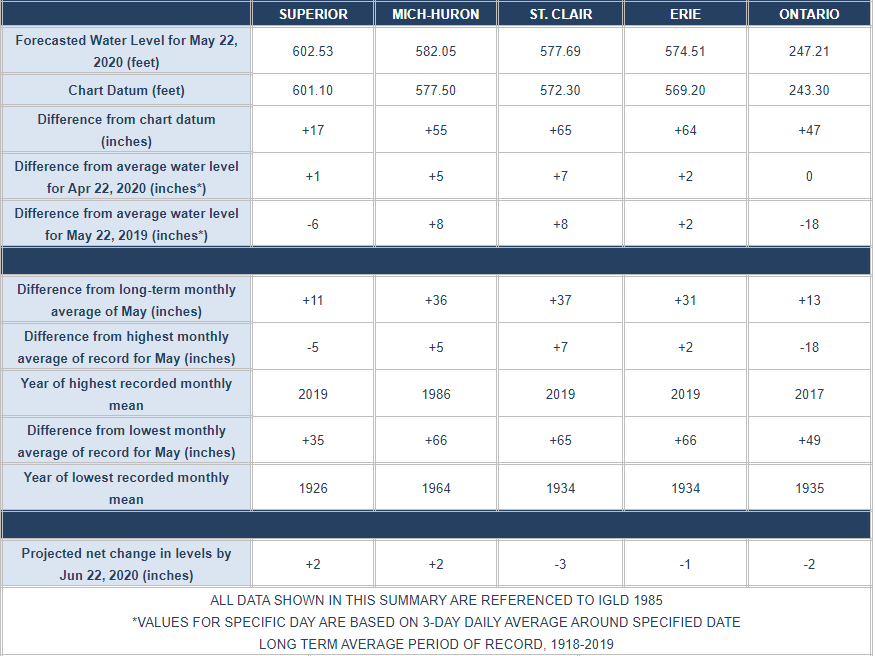
There was significant rainfall in Michigan and Illinois over the last week. Water levels continue to be well above average and near or above record high levels. From a month ago the water levels on Lakes Superior, Michigan-Huron, St Clair, Erie & Ontario are up 1, 5, 7, 2, 0 inches respectively. Lakes Superior and Ontario are down 6 & 18 inches, respectively, and Lakes Michigan-Huron, St. Clair, & Erie are 8, 8 & 2 inches higher respectively, than they were at this time last year. Lakes Superior, Michigan-Huron, St Clair, Erie & Ontario are 11, 36, 37, 31 & 13 inches, respectively, above their long term May average. Lakes Michigan-Huron, St. Clair and Erie are 5, 7 & 2 inches higher, respectively than their previous record highs for May.
In a month’s time, the level of Lakes Superior and Michigan Huron, are both expected to rise by 2 inches, Lakes St. Clair, Erie & Ontario are expected to be down between 1 and 3 inches. Outflows from Lake Superior into the St. Mary’s River and Lake Michigan-Huron’s outflow into the St. Clair River are predicted to be above average for this month. Lake St. Clair’s outflow through the Detroit River and Lake Erie’s outflow through the Niagara River are also forecasted to be above average in this month. In addition, Lake Ontario’s outflow through the St. Lawrence River is projected to be above average for this month.
High water levels and potentially record high water levels are expected to persist for at least the next six months, so flood prone areas are expected to remain vulnerable. Water levels and flows in the connecting channels can be significantly impacted by ice during the winter months.
With regard to the forecast graph below, it should be noted that USACE are predicting that the most likely outcome is that levels will exceed last year’s high (which was in July) by 2.6” at the end of June. There has been less ice cover and therefore more evaporation than there was last winter. However, high precipitation levels between now and the end of June could drive levels above this estimate. Currently precipitation levels year to date are lower than last year, but last year there was significant precipitation and a steep rise in levels in May and June.
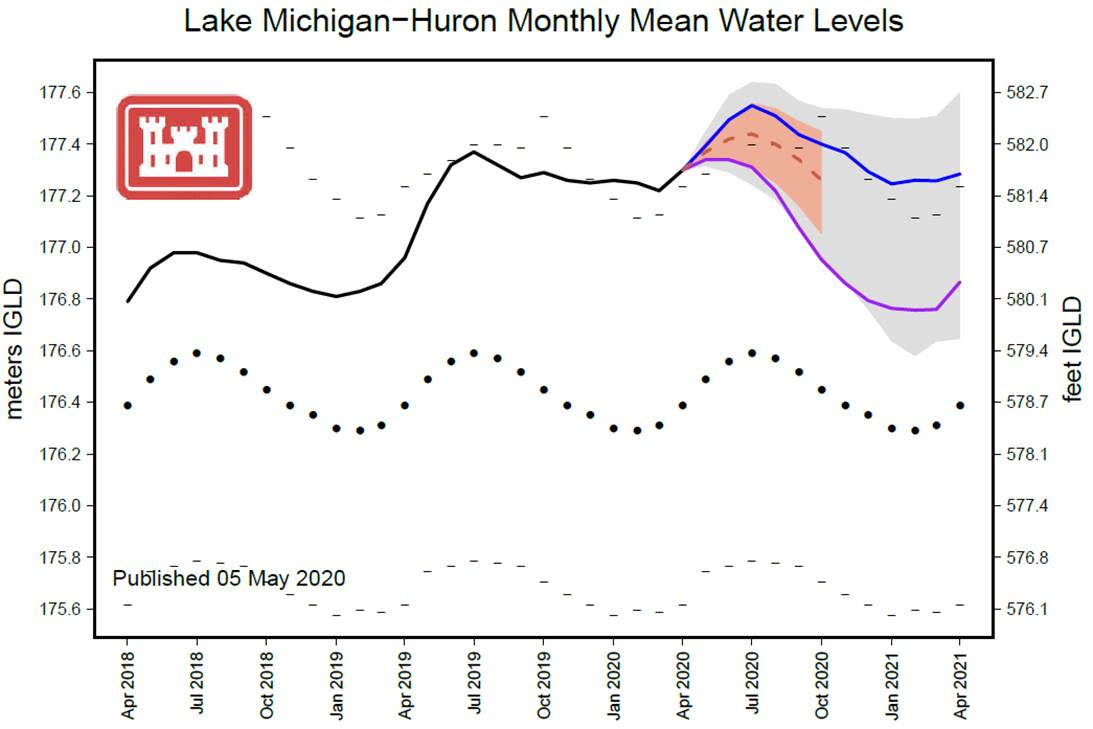
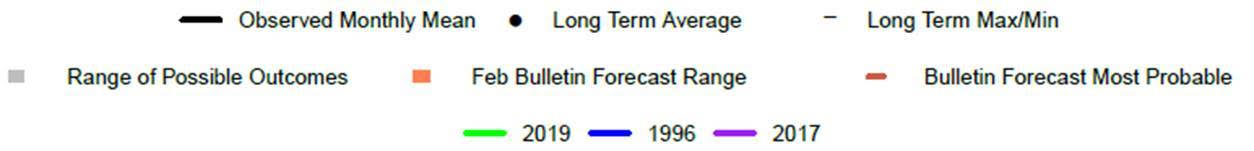
Please note that the purple and blue lines in the USACE forecast graph show what happened with water level changes from month to month in each of the years 2012-3 and 2017-18 – they do not represent actual water levels in those years.
Over the last week the high precipitation in the west part of the basin has meant that water levels tracked last years rate of increase (see the first graph). It remains to be seen whether this trend will continue for the balance of May and in June.