2021-Feb-01
January 31 Water Levels Report
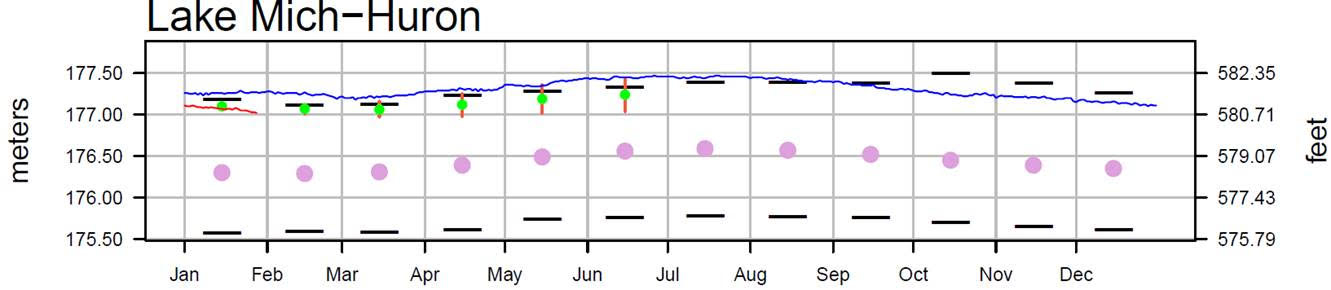
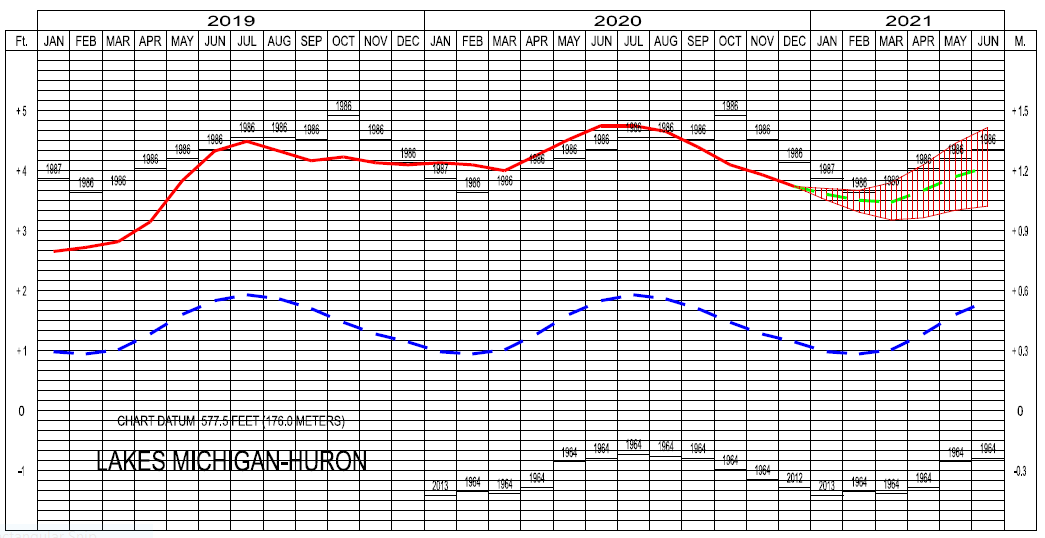
Water levels continue to be well above average and near record high levels, but all the lakes are continuing their seasonal declines. Lake Michigan-Huron continues to be below the level it was at this time last year – see first graph below. All the lakes are now lower than they were at this time last year.
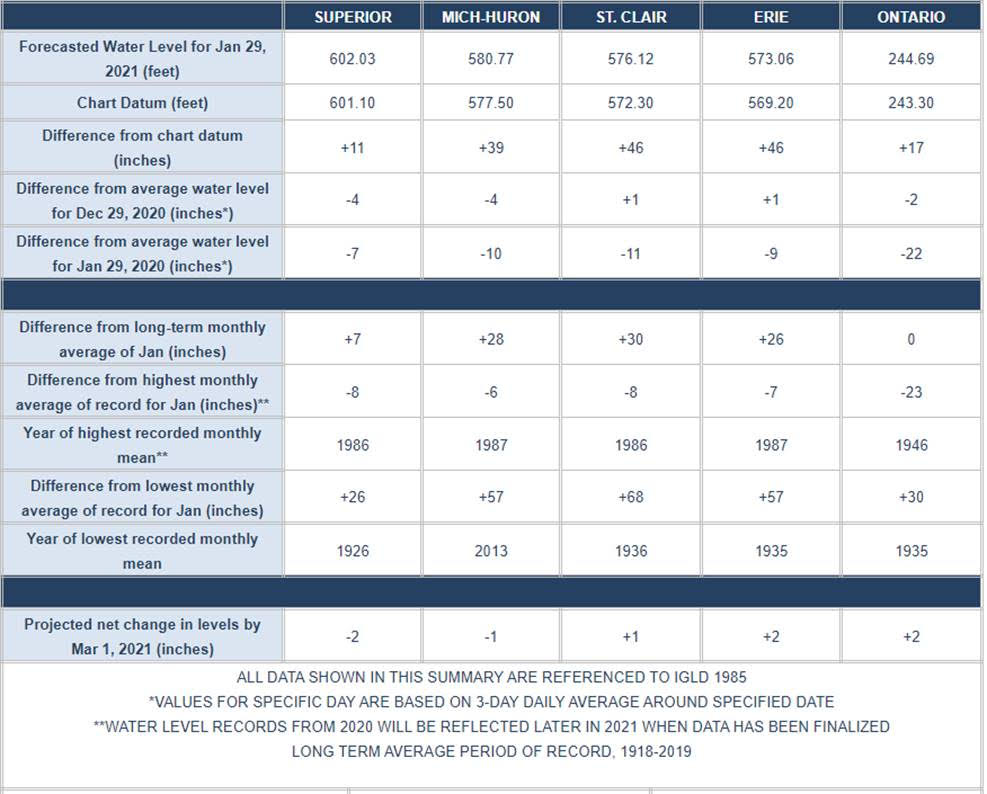
From a month ago the water levels on Lakes Superior, Michigan-Huron and Ontario are down 4, 4 & 2 inches respectively, Lakes St Clair & Erie are both up 1 inch. Lakes Superior, Michigan-Huron, St Clair, Erie & Ontario, are lower by 7, 10, 11, 9 & 22 inches, respectively, than they were at this time last year. Lakes Superior, Michigan-Huron, St Clair, Erie & Ontario are 7, 28, 30, 26 & 0 inches, respectively, above their long term January average. All the lakes are now below their January record highs.
In a month’s time, the levels of Lakes Superior & Michigan-Huron, are expected to be lower by 1-2 inches, and Lakes St Clair, Erie & Ontario are expected to rise by 1-2 inches. High water levels and potentially record high water levels are expected to persist for at least the next six months, so flood prone areas are expected to remain vulnerable.
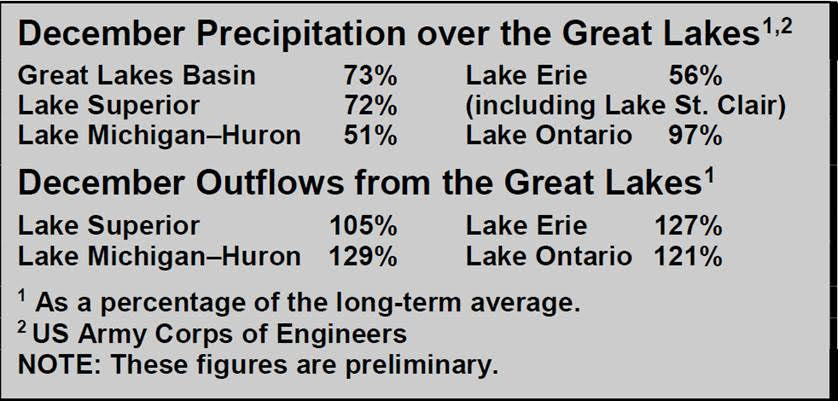
Outflows from Lake Superior into the St. Mary’s River and Lake Michigan-Huron’s outflow into the St. Clair River are predicted to be above average for this month. Lake St. Clair’s outflow through the Detroit River and Lake Erie’s outflow through the Niagara River are also forecasted to be above average in this month. In addition, Lake Ontario’s outflow through the St. Lawrence River is projected to be above average for this month.
This report below shows the most recent month of precipitation and outflows published by Level News:
With regard to the forecast graph below, and the more recently updated first graph in this report, the USACE is predicting that the most likely outcome is that levels will continue to decline through January & February, with the normal seasonal increase commencing in March and continuing into June.
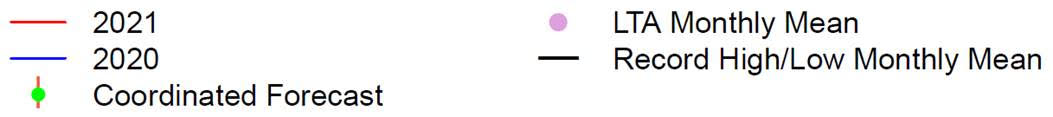
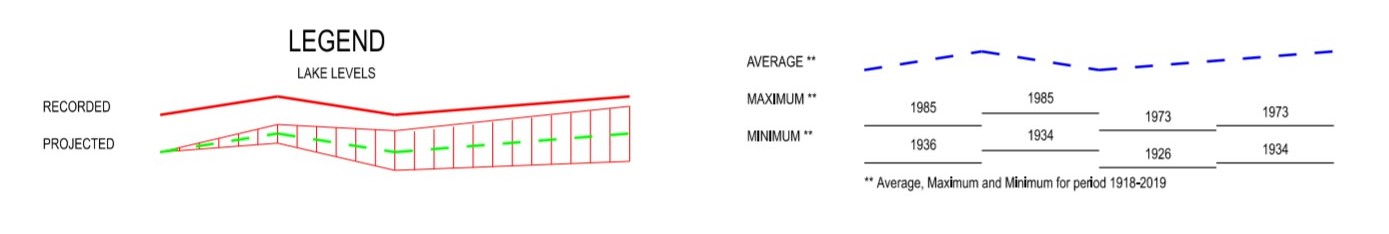
Monthly mean water levels for the previous year and the current year to date are shown as a solid line on the hydrographs. A projection for the next six months is given as a dashed line. This projection is based on the present condition of the lake basin and anticipated future weather. The shaded area shows a range of possible levels over the next six months dependent upon weather variations. Current and projected levels (solid and dashed lines) can be compared with the 1918-2019 average levels (dotted line) and extreme levels (shown as bars with their year of occurrence). The legend below further identifies the information on the hydrographs.
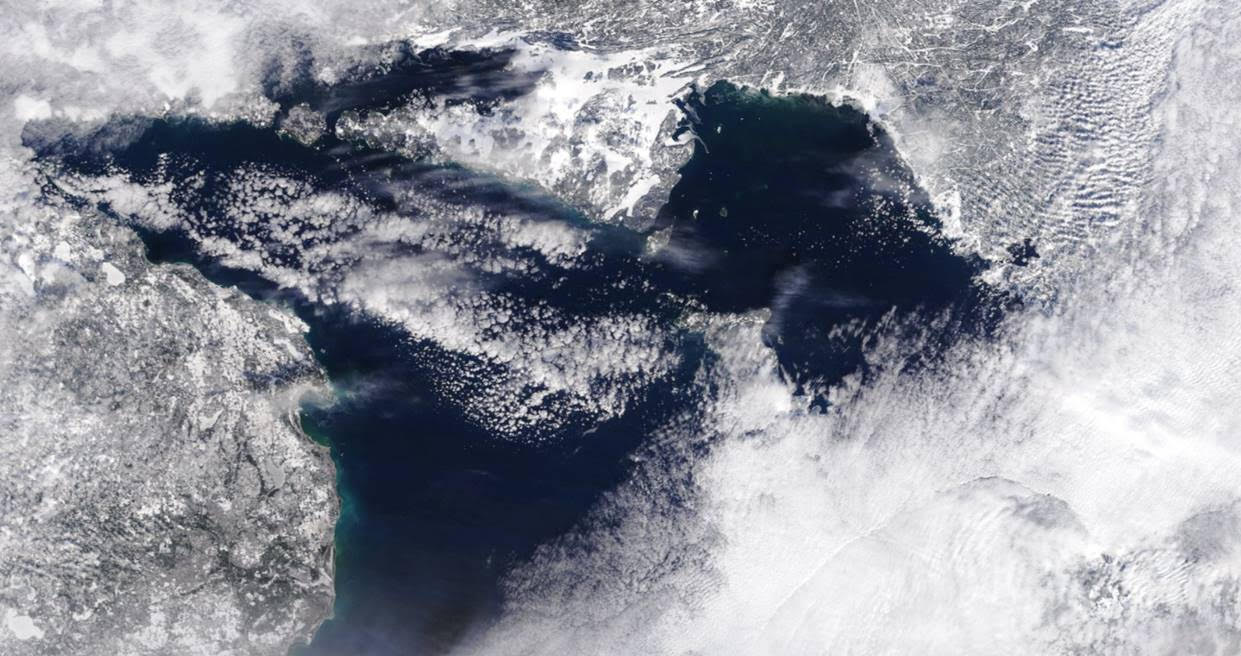
The satellite image below shows that ice cover is now beginning to build along most of the shoreline on the north and east coasts of Georgian Bay and into the Bay of Islands. Over-lake evaporation is likely responsible for partially obscuring the image. Coverage continues to be very low for this time of the year.