
2020-Aug-10
August 9 Water Levels Report
Over the last week many areas in the Great lakes basin received significant precipitation. Rainstorms are also predicted for most of the basin for Sunday and Monday.
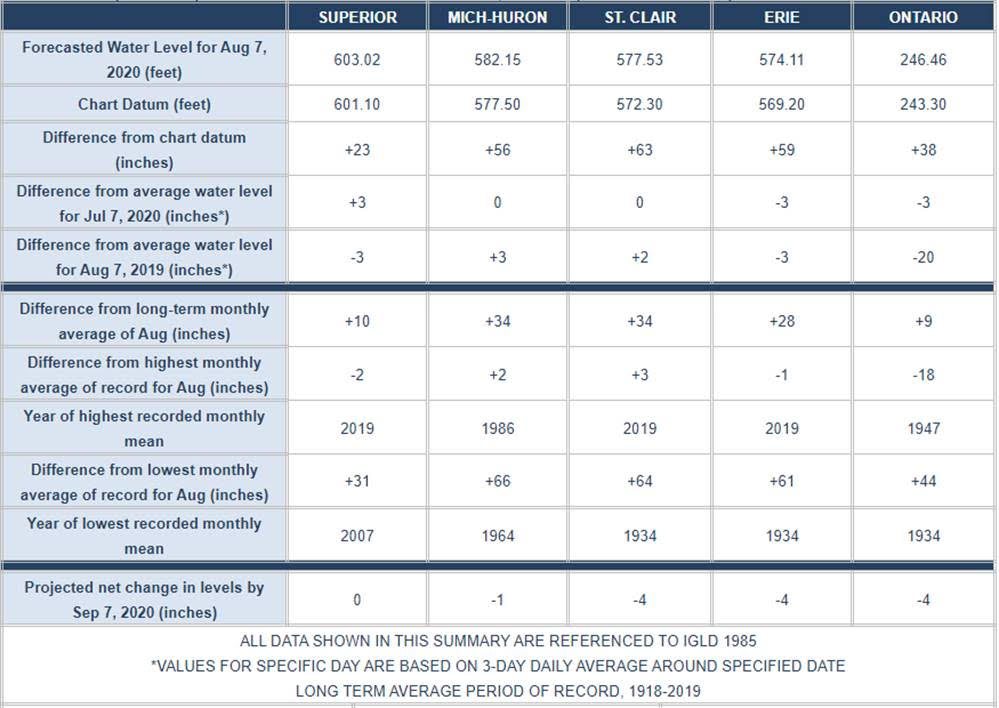
Water levels continue to be well above average and near or above record high levels. From a month ago the water level on Lake Superior is up 3 inches, Lakes Michigan-Huron and St Clair are unchanged, and Erie & Ontario are both down 3 inches. Lakes Superior, Ontario, & Erie are lower by 3, 3 & 20 inches, respectively, and Lakes Michigan-Huron & St. Clair are 3 & 2 inches higher, respectively, than they were at this time last year. Lakes Superior, Michigan-Huron, St Clair, Erie & Ontario are 10, 34, 34, 28 & 9 inches, respectively, above their long term August average. Lakes Michigan-Huron & St. Clair are 2 & 3 inches higher, respectively than their previous record highs for August. All the other lakes are below their August record high.
In a month’s time, the level of Lake Superior is expected to be unchanged, and Lakes Michigan-Huron, St Clair, Erie & Ontario are expected to be down between 1 and 4 inches. Outflows from Lake Superior into the St. Mary’s River and Lake Michigan-Huron’s outflow into the St. Clair River are predicted to be above average for this month. Lake St. Clair’s outflow through the Detroit River and Lake Erie’s outflow through the Niagara River are also forecasted to be above average in this month. In addition, Lake Ontario’s outflow through the St. Lawrence River is projected to be above average for this month.
High water levels and potentially record high water levels are expected to persist for at least the next six months, so flood prone areas are expected to remain vulnerable.
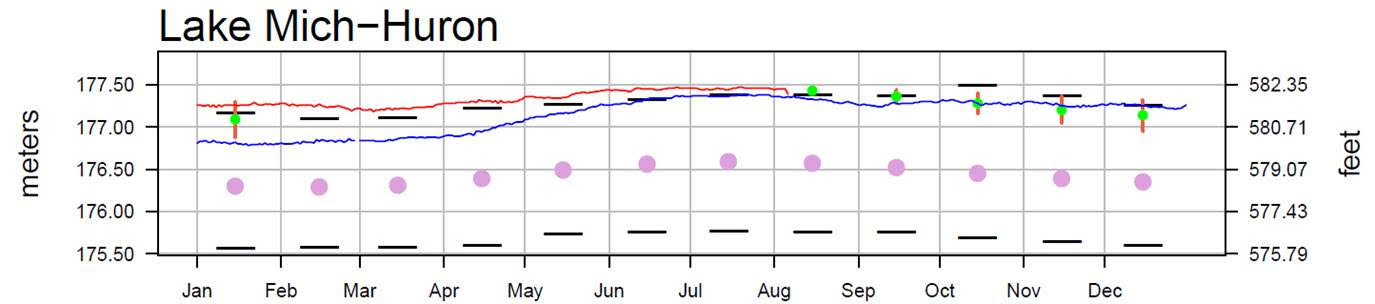
With regard to the forecast graph below, and the more recently updated first graph in this report, the USACE is predicting that the most likely outcome is that levels will not go up any further this year, remain much the same as they are now (about 3 inches higher than last year) through August, and then start to decline in September.
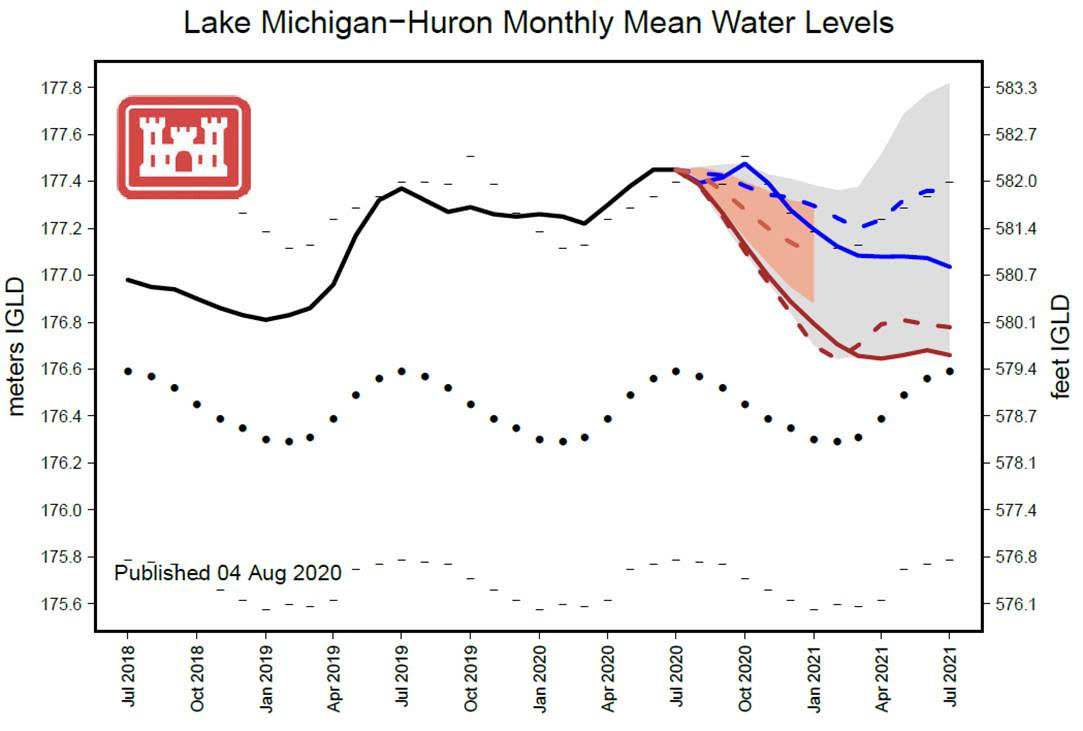

Please note that the purple and blue lines, and dotted lines, in the USACE forecast graph show what happened with water level changes from month to month in each of the years 1986-87, 1977-78, 1930-31 and 1976-77 – they do not represent actual water levels in those years.