
2020-Apr-27
April 26 Water Levels Report
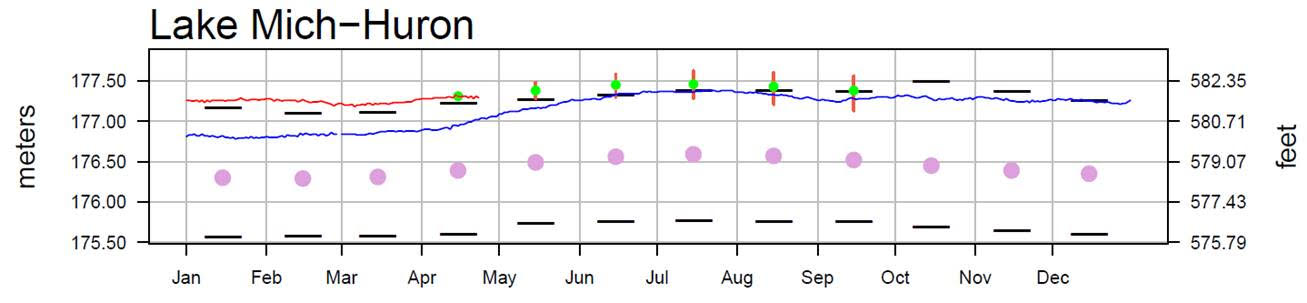
Water levels continue to be well above average and near or above record high levels, but the difference from last year’s level for Lake Michigan-Huron has declined by 3 inches over the last week (from 14 to 11 inches higher) reflecting the drier conditions.
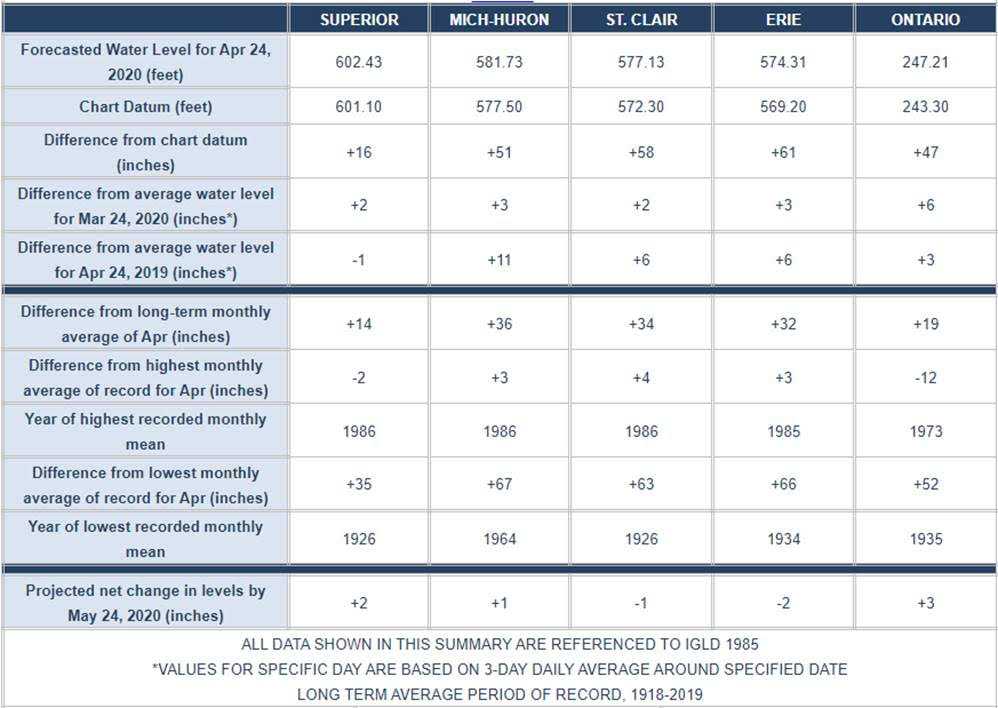
From a month ago the water levels on Lakes Superior, Michigan-Huron, St Clair, Erie & Ontario are up 2, 3, 2, 3, 6 inches respectively. Lakes Superior is down one inch and Lakes Michigan-Huron, St. Clair, Erie & Ontario are 11, 6, 6 & 3 inches higher respectively than they were at this time last year. Lakes Superior, Michigan-Huron, St Clair, Erie & Ontario are 14, 36, 34, 32 & 19 inches, respectively, above their long term April average. Lakes Michigan-Huron, St. Clair and Erie are 3, 4 & 3 inches higher, respectively, than their previous record highs for April. In a month’s time, the level of Lakes Superior, Michigan Huron, St. Clair are expected to rise by 2, 1, 3, inches respectively, whereas Lakes Erie & Ontario are expected to drop by 1 & 2 inches respectively. Rises in lake levels are expected during May and June when typically increased rainfall occurs.
Outflows from Lake Superior into the St. Mary’s River and Lake Michigan-Huron’s outflow into the St. Clair River are predicted to be above average for this month. Lake St. Clair’s outflow through the Detroit River and Lake Erie’s outflow through the Niagara River are also forecasted to be above average in this month. In addition, Lake Ontario’s outflow through the St. Lawrence River is projected to be above average for this month.
High water levels and potentially record high water levels are expected to persist for at least the next six months, so flood prone areas are expected to remain vulnerable. Water levels and flows in the connecting channels can be significantly impacted by ice during the winter months.
With regard to the forecast graph below, it should be noted that USACE have updated their six month projection below, and now predict that the most likely outcome is that levels will exceed last year’s high (which was in July) by approximately 4” at the end of June. There has been less ice cover and therefore more evaporation than there was last winter. However, if precipitation is much the same as last year over the next 2+ months, then water levels will likely be nearer the top end of the predicted range (orange area in graph below) – which now shows a high of approximately 10” above last year’s high in July, but occurring this year at the end of June. Currently precipitation levels year to date are lower than last year, but the key months for determining how much water levels will rise (or fall) will be April to June.
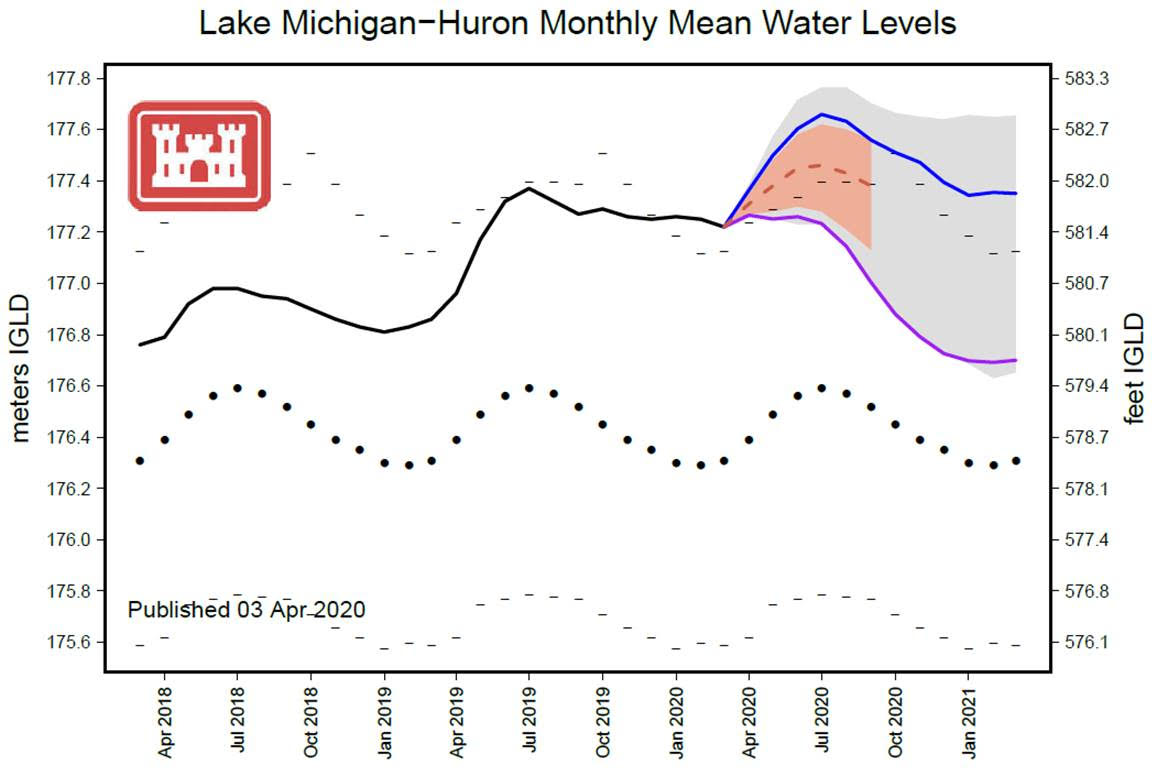
Please note that the green, blue and purple lines in the USCE forecast graph show what happened with water level changes from month to month in each of the years 2019, 1996 and 2017 – they do not represent actual water levels in those years.
It is encouraging that we are now only 11 inches over last year’s level (instead of 14 inches last week), but it is too early to tell where water levels will end up this summer.