2020-Apr-16
April 12 Water Levels Report
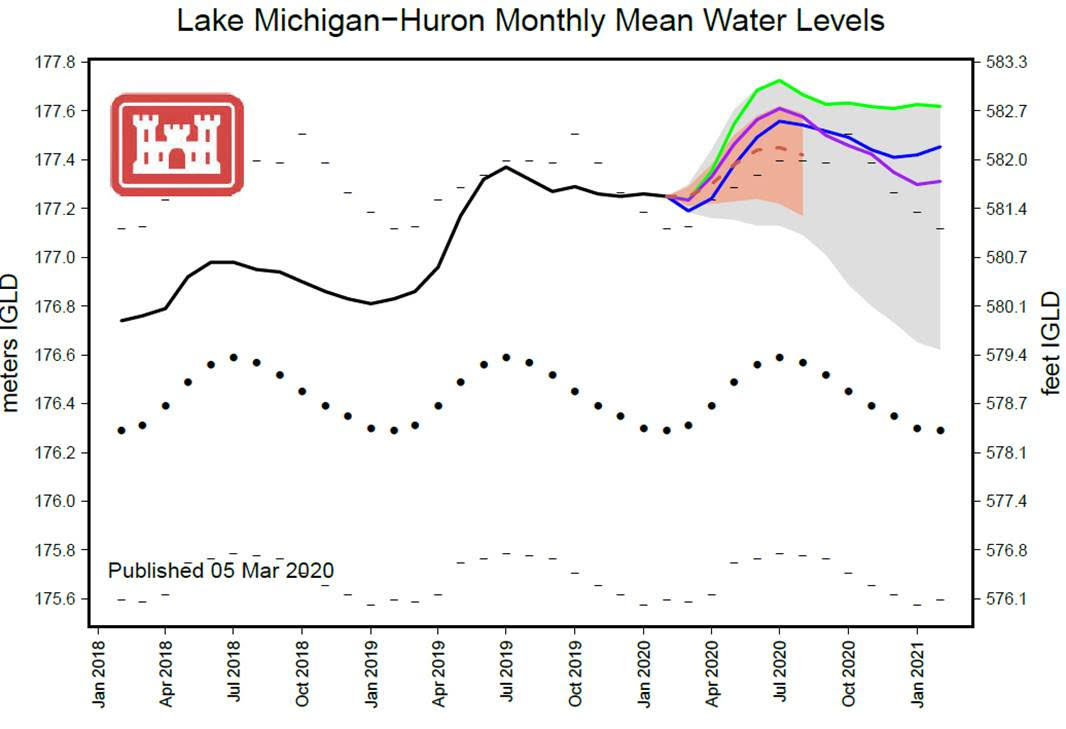
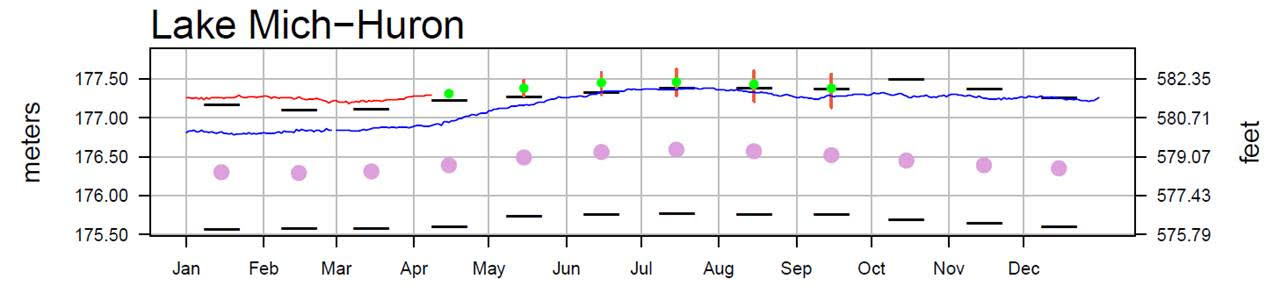
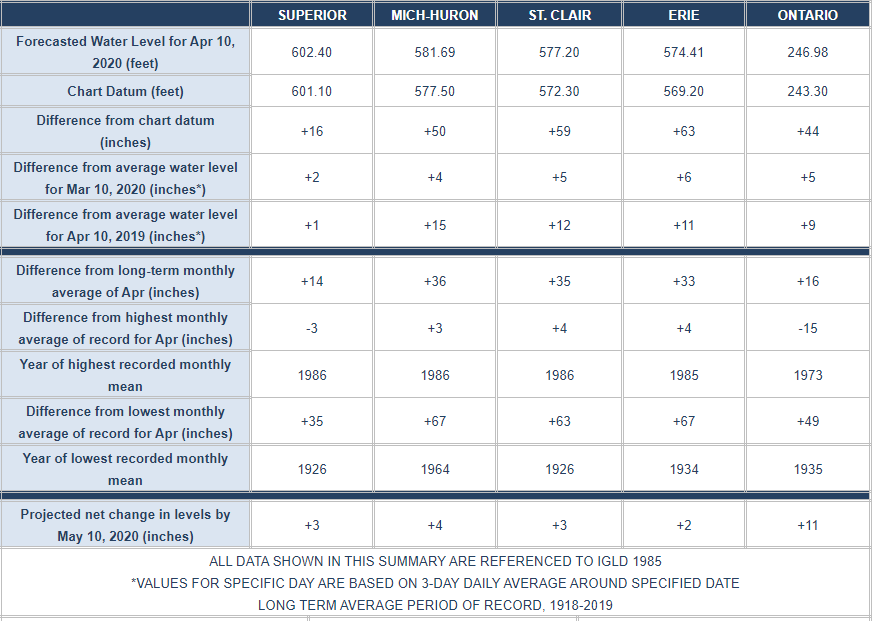
Water levels continue to be well above average and near or above record high levels. From a month ago the water levels on Lakes Superior, Michigan-Huron, St Clair, Erie & Ontario are up 2, 4, 5, 6, 5 inches respectively. Lakes Superior, Michigan-Huron, St. Clair, Erie & Ontario are 1, 15, 12, 11 & 9 inches higher respectively than they were at this time last year, and 14, 36, 35, 33 & 16 inches, respectively, above their long term April average. Lakes Michigan-Huron, St. Clair and Erie are 3, 4 & 4 inches higher, respectively, than their previous record highs for April.
In a month’s time, the level of Lakes Superior, Michigan Huron, St. Clair, Erie & Ontario are expected to rise by 3, 4, 3, 2 & 11 inches respectively. This rise in lake levels is expected during spring months when typically increased rainfall and snowmelt occurs.
Outflows from Lake Superior into the St. Mary’s River and Lake Michigan-Huron’s outflow into the St. Clair River are predicted to be above average for this month. Lake St. Clair’s outflow through the Detroit River and Lake Erie’s outflow through the Niagara River are also forecasted to be above average in this month. In addition, Lake Ontario’s outflow through the St. Lawrence River is projected to be above average for this month.
High water levels and potentially record high water levels are expected to persist for at least the next six months, so flood prone areas are expected to remain vulnerable. Water levels and flows in the connecting channels can be significantly impacted by ice during the winter months.
With regard to the forecast graph below, it should be noted that USACE predicts that the most likely outcome is that levels will exceed last year’s high in July by 5.3”. There has been less ice cover and therefore more evaporation than there was last winter. However, if precipitation is much the same as last year over the next 2.5 months, then water levels will likely be nearer the top end of the predicted range (orange area in graph below) – which shows 13” above last year’s high in July. Currently precipitation levels year to date are lower than last year, but the key months for determining how much water levels will rise (or fall) will be April to June.